

Are We Setting the Right Price?


Are We Setting the Right Price?
As an actuarial consulting firm, we spend a lot of time deriving the specific cost for F&I products, both from an overall perspective and down to the granular level. For example, we develop models which inform you that the cost of a wrap service contract for a Hyundai Elantra with 30,000 miles and 2.5 years of service will be $45 less than a Hyundai Elantra with 45,000 miles and 3.5 years of service. (Note, we just made up these numbers).
So we are very precise with our estimates of what drives service contract claims. However, we don’t seem to be very precise when setting the final price to the consumer. Many administrators charge the same administration fee for all the contracts within the same product That makes little sense when some contracts are two years in length and others may be eight years in length. It will cost the administrator significantly more money to administer a longer contract (which will generate substantially more claims).
This problem is even worse with dealer and agent markups, which are often the same dollar amount regardless of the underlying coverage. The result is that the differential in the actual retail prices of service contracts are much narrower (from a percentage standpoint) than the underlying costs.
Percentages vs. Flat Dollar
A curious thing seems to have happened in the service contract industry: the common use of flat dollar amounts for dealer margin and administrative costs. Traditional insurance (including credit insurance) relies on percentages for acquisition and perhaps a mix of flat dollar and percentages for administration costs.
Percentages have definite advantages but these are not perfect. One problem with using percentages is that small dollar policies are not practical because the acquisition costs are too low to entice production.
One example is renters insurance. Renters insurance (which covers an insured’s belongings but not the structure) is a great product which protects the consumer against theft, fire, natural disaster, and personal liability. It is also fairly inexpensive, with typical premiums of less than $300 per year.
Since the premium is so low, the typical commission arrangement of 15 percent would provide less than $45 of commission. Because of this, agencies will rarely promote or market this product and penetration rates are low. According to the Insurance Research Council, only 43 percent of renters have renters insurance.
Too Much Coverage
Returning to service contracts, we often see higher sales on the most expensive coverage options – such as low deductibles, more coverage, and more expensive vehicles. While it may be true that buyers of these vehicles want these plans, it is also true that for most buyers the difference in the price of these plans (once again, in percentages) may not be so great.
While it is great to sell the most coverage, we might be seeing lost sales on the more discounted plans. It is often a murky world at the dealership, with trade-ins, negotiation, and other factors often driving the F&I product purchase decision. But flat dollar margins and administrative costs are making the most affordable products less affordable.
One option might be to use a combination of the two (percentage and flat dollar amounts) to price service contracts. For example, suppose the average reserve for a contract is $1,156, the administrator fee is $200 and the average dealer markup is $400. The table below shows the pricing options using flat dollar additions versus using 50 percent flat dollar and 50 percent percentage mark ups:
Reserve | Percent of Contract | Flat Administrator | Flat Markup | Customer Price | 50% Method | |
400 | 5% | 200 | 400 | 1000 | 804 | |
600 | 12% | 200 | 400 | 1200 | 1056 | |
800 | 15% | 200 | 400 | 1400 | 1308 | |
1000 | 15% | 200 | 400 | 1600 | 1560 | |
1200 | 15% | 200 | 400 | 1800 | 1811 | |
1400 | 15% | 200 | 400 | 2000 | 2063 | |
1600 | 10% | 200 | 400 | 2200 | 2315 | |
1800 | 8% | 200 | 400 | 2400 | 2567 | |
2000 | 5% | 200 | 400 | 2600 | 2819 | |
Average | 1156 | 100% | 200 | 400 | 1756 | 1756 |
As you can see, the overall average margin is the same, but there is more price differential with allocating margin partially on percentage markups.
This reflects basic cost accounting for both the dealer and the administrator – higher priced coverages should not only reflect higher reserves for claims but also higher administrator fees and higher margins for dealers.
Beyond Cost Accounting
So far, we’ve limited our discussion to a more proper application of cost accounting, but we’ve ignored the other half of the equation: the demand for the product.
As we all know, some items are priced more for the demand than the cost of the supply. Airline tickets and hotel rooms are almost exclusively priced on the demand for the items.
For a hotel, it makes little sense to allow a room to remain unsold for the night when a lower price would entice a traveler to stay there. The same is true for selling an airline ticket – the plane will fly regardless of whether the seat is sold.
For dealers, the margin is controllable and could be optimized. For example, selling a service contract with a $100 margin is preferable to not selling the contract at all – and receiving a margin of $0.
For example, the willingness of a customer to pay for a service contract might depend on a variety of things, including:
The customer’s demographic profile
The vehicle that is being purchased
The time of day the sale is made
The dealership
The salesperson
The F&I manager
Any other factors
The price of the contract
The only one of these items that can easily be changed instantly is the price of the contract.
Wouldn’t it make sense to offer higher prices to those customers who see the benefit of the contract (and are more likely to purchase a contract) and lower prices to entice those who are less likely to purchase?
Using the information above, one can build a model which will predict the likelihood of purchase for any price. Of course, this model is dependent on the underlying data – both the amount and its predictive qualities.
Once the predicted sale rate is determined, the margin can be determined to increase the likelihood of selling the service contract. Using such a model would allow the dealership to increase the penetration rate for service contracts and the overall profitability for the book.
Option | Customer A Margin | Probability of Purchase | Customer B Margin | Probability of Purchase | Customer C Margin | Probability of Purchase |
1 | 400 | 70% | 400 | 85% | 400 | 50% |
2 | 500 | 60% | 500 | 70% | 500 | 45% |
3 | 600 | 50% | 600 | 55% | 600 | 40% |
4 | 700 | 40% | 700 | 40% | 700 | 35% |
5 | 800 | 30% | 800 | 25% | 800 | 30% |
6 | 900 | 20% | 900 | 10% | 900 | 25% |
7 | 1000 | 10% | 1000 | 5% | 1000 | 20% |
Current | 700 | 40% | 700 | 40% | 700 | 35% |
Optimal | 500 | 60% | 500 | 70% | 700 | 35% |
Current | Optimized | Change | ||||
Margin | 700 | 567 | -19% | |||
Close Rate | 38% | 53% | 37% | |||
Profit/Sale | 268 | 298 | 11% |
In this hypothetical case, the dealer can increase the average profit by 11 percent and offer a lower margin (but sell more contracts). Typical results for optimization projects are a 5 to 10 percent increase in profitability.
To begin a project such as this, you need data. If you are not capturing data which reflects your customers, your F&I product offerings and the results of your sales process (the margin and products offered and customer’s decision to a specific offering) you should begin to collect that data now for future analysis.
The next step is to create a model which predicts the sales penetration for products. This is helpful to see what factors are driving sales, such as product, vehicle, customer demographics or the F&I personnel.
Finally, this information can be used to develop a more robust pricing strategy for the dealership – one that incorporates the customer demand along with considerations such as negotiations, dealer objectives, long term customer relationships, refund exposure and all of the other factors which are part of the F&I process.
Administrators who price their products more effectively should see some increased penetration as lower priced coverage options should be more attractive as well as less costly to administer.
Regardless of your pricing strategy, the “Dark Ages” of simply adding flat dollars to a premium reserve should come to an end.
More Industry

Autos More Appealing
Consumers gave new cars better scores again this year for design, performance and more as mass-market brands kept gaining on premium lineups, JD Power found in an annual poll.
Read More →
Used EVs Defy Overall Market
While the used-car market saw three months of price declines or stagnation, the used EV segment did the opposite – rising for three straight months.
Read More →
Gone to the Dogs
A Stellantis brand decided to have some fun with one of its SUVs’ design to address growing emphasis on family pets.
Read More →
OEM Poll Sees Industry Evolution
Kerrigan Advisors’ survey of automakers finds that tariffs, technology, network tightening and other factors are poised to reshape auto retail.
Read More →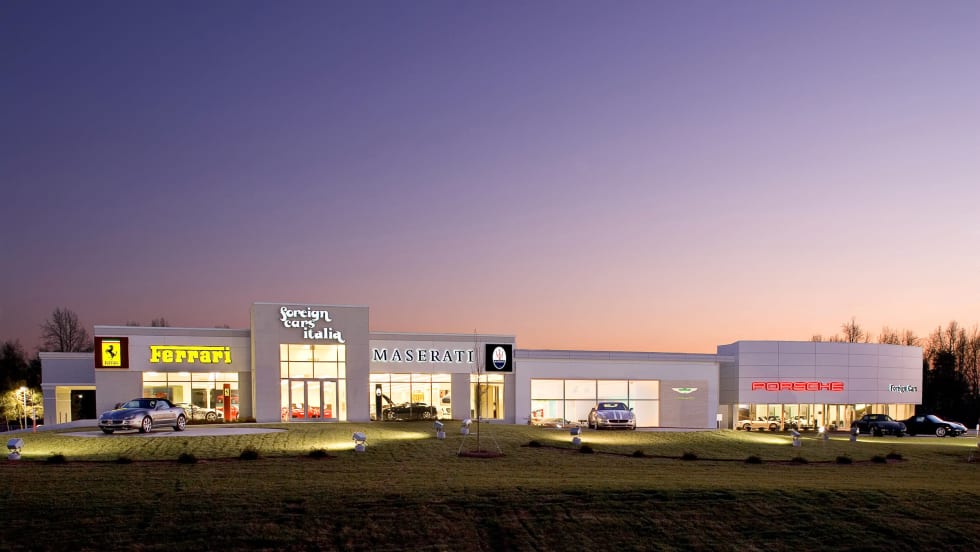
Luxe N.C. Dealerships Change Hands
A collection of Italian and English brand franchises were handed off to the owner’s friend in the business and include the Carolinas’ only Ferrari retail stores.
Read More →
Exposure Drives Interest in Chinese Cars
At a recent demonstration, consumers had the chance to ride in a Chinese-branded vehicle, a firsthand experience that improved their perceptions and purchase intent.
Read More →
Automotive Consumers Sink Further in Debt
Most financing metrics hit records in the second quarter as more buyers locked themselves into long terms and high monthly payments.
Read More →
Agent Advocate
Rob Mancuso, who comes from a long line of auto dealers, values general agents’ place in the industry and makes a case for them taking an even bigger seat at the table.
Read More →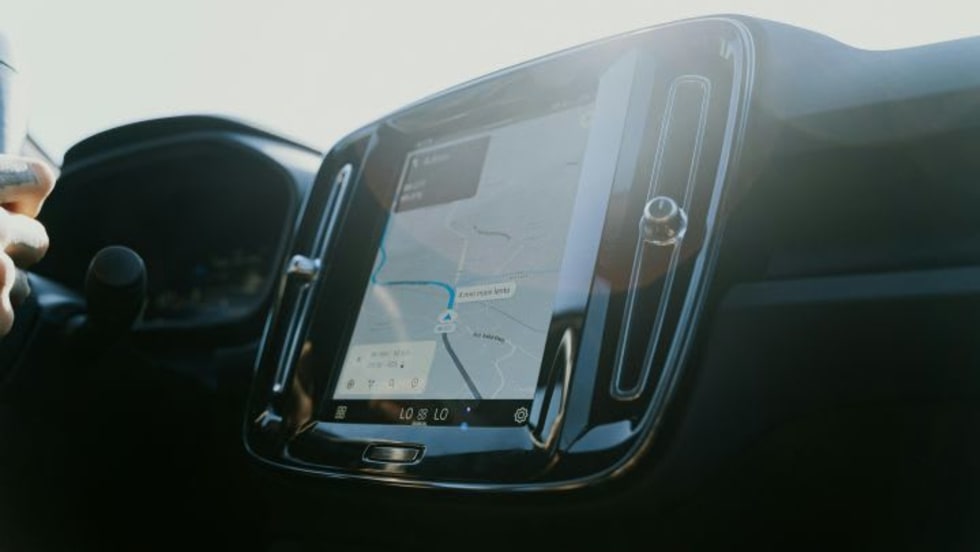
Driving Under Distraction
Though consumers gave higher marks to new vehicles in JD Power’s most recent initial-quality poll, high-tech interference worsened, pointing to craving for simplicity.
Read More →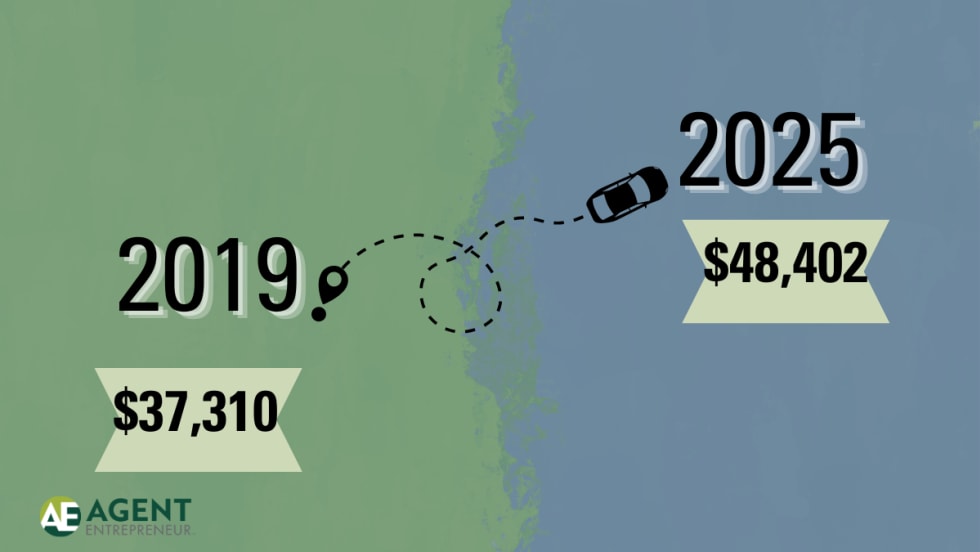
Affordable New Cars a Thing of the Past
More than one out of five new vehicles sell for more than $60,000, according to Edmunds. That's up 7% compared to prepandemic 2019.
Read More →