

Edmunds.com: August Incentives Stronger than Typical

SANTA MONICA, Calif. — With more budget-conscious shoppers and the CARS "hangover" still lingering, there was a heavier dose of incentives than usual during August, according to Edmunds.com.
Specifically, automakers placed an average of $2,681 in incentives on each vehicle they sold during the month, marking a 3-percent slide from July, but a 9.2-percent hike from August 2009 when CARS was drawing to a close, Auto Remarketing reported.
"Historically, August incentives are lower than in July because there is less old-model-year inventory to sell at year-end closeout sale prices," explained Jessica Caldwell, Edmunds.com senior analyst.
"However, this year many automakers are more generous than usual, supporting the bargain-hunting mentality that is driving most car purchases these days and making up for the 'Cash for Clunkers' hangover," she continued. "Meanwhile, inventory is at a remarkably low level: It now takes about 50 days to sell the average vehicle after it arrives at a dealership, where last summer it took more than 70 days to turn."
That said, some OEMs are scaling back on incentives and employing a strategy of selling less, but spending less.
"It appears that some automakers are willing to sell fewer cars while spending less on incentives, thus make more profit per vehicle sold — a sound strategy really," Michelle Krebs, senior analyst for Edmunds.com, pointed out on AutoObserver.com.
"They are learning to live on less — at least in terms of volume — as all Americans are," she added.
Of the six largest OEMs, General Motors had the highest average spending at $3,738 per vehicle sold, which was down from $4,185 in July, but up from $3,237 a year ago.
Chrysler was second. It clipped its incentive spending down to $3,216 per vehicle sold from the $3,391 in August 2009. However, its August average was greater than its July average of $3,132.
Ford spent $3,127 per vehicle sold, up from $3,111 in July and $3,152 in August 2009.
Nissan posted a record incentive spending average in August of $2,959, which was just slightly higher than the month-ago figure ($2,957) and up from $2,557 a year ago.
Toyota's incentive spending averaged $2,180 per vehicle sold, versus $2,234 last month and $1,622 in the same period of 2009. Honda averaged $1,708 for incentive spending, compared with $1,736 in July and $898 a year ago.
Combined, the Big 3 spent an average of $3,405 on incentives per vehicle sold, compared with $3,589 the previous month. Incentive spending for European OEMs was lifted to $2,643, up from $2,456 in July.
Japanese brands spent an average of $2,083 per vehicle sold, down from $2,127 from the prior month.
Korean brands' spending averaged $1,819 during July, compared with $1,907 the month before.
Continuing on, Edmunds.com estimated that there was roughly $2.76 billion that the industry combined to spend on incentives for the month. This marked a 4.7-percent decline from July's aggregate amount.
Of August's aggregate amount, $1.5 billion was from Big 3 automakers, which combined spent 55 percent of the industry aggregate.
Japanese automakers commanded a 30.6-percent share as they put a total of $845 million toward incentives. Incentive spending for European OEMs hit $238 million for an 8.6 percent share. Korean automakers represented 5.7 percent of the aggregate as their spending totaled $158 million.
Breaking it down by vehicle category, the segment with the heaviest average spending was the premium sports cars category, which averaged $8,221 per vehicle sold. Second from the top were large trucks ($4,359).
Conversely, automakers spent the least amount, on average, on subcompact cars ($1,215). Second from the bottom were sports cars ($1,422).
When looking at incentive spending proportionately to sticker price, the heaviest category was the large car segment (12.9 percent). Large trucks were No. 2 (11.8 percent).
Meanwhile, the slightest average was in the premium luxury car segment (3.4 percent). Sports cars were next (3.9 percent).
Among brands, Lincoln had the greatest average incentive spending ($4,832) with Saab next ($4,790). Scion was at the bottom ($497) and smart was second from the bottom ($502).
Based on sticker price proportion, Mercury was tops (14.8 percent) and Chrysler was second (13.5 percent). Subaru ranked lowest (2 percent) and Porsche was next (2.7 percent).
More Industry
Autos More Appealing
Consumers gave new cars better scores again this year for design, performance and more as mass-market brands kept gaining on premium lineups, JD Power found in an annual poll.
Read More →
Used EVs Defy Overall Market
While the used-car market saw three months of price declines or stagnation, the used EV segment did the opposite – rising for three straight months.
Read More →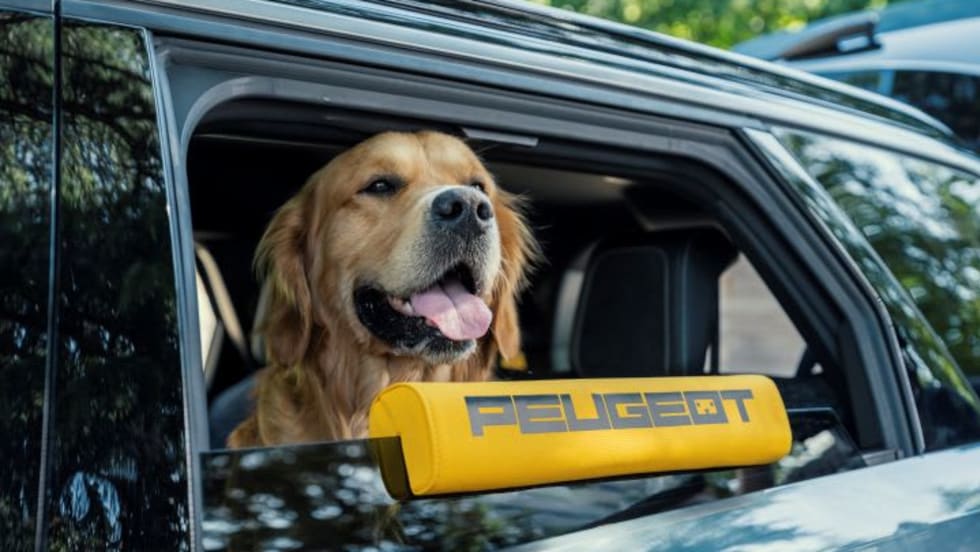
Gone to the Dogs
A Stellantis brand decided to have some fun with one of its SUVs’ design to address growing emphasis on family pets.
Read More →
OEM Poll Sees Industry Evolution
Kerrigan Advisors’ survey of automakers finds that tariffs, technology, network tightening and other factors are poised to reshape auto retail.
Read More →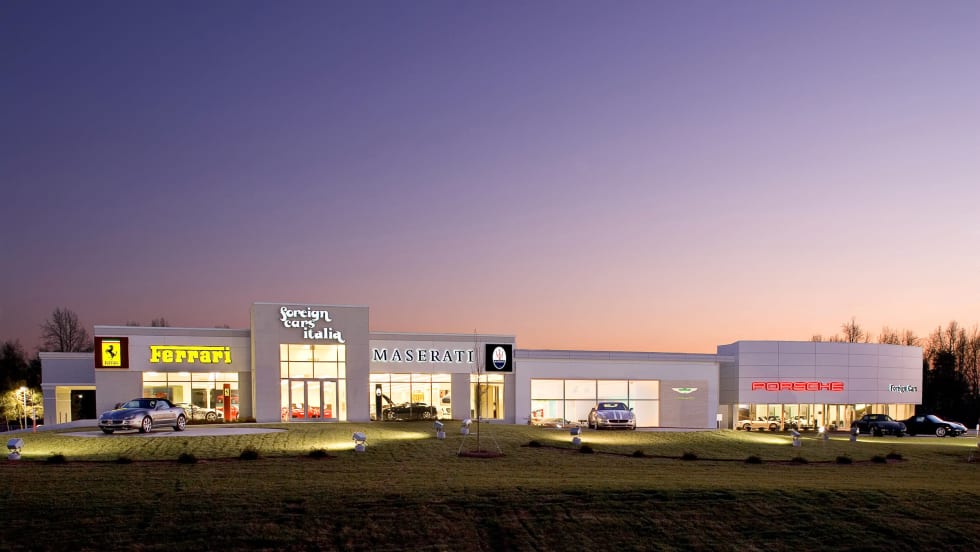
Luxe N.C. Dealerships Change Hands
A collection of Italian and English brand franchises were handed off to the owner’s friend in the business and include the Carolinas’ only Ferrari retail stores.
Read More →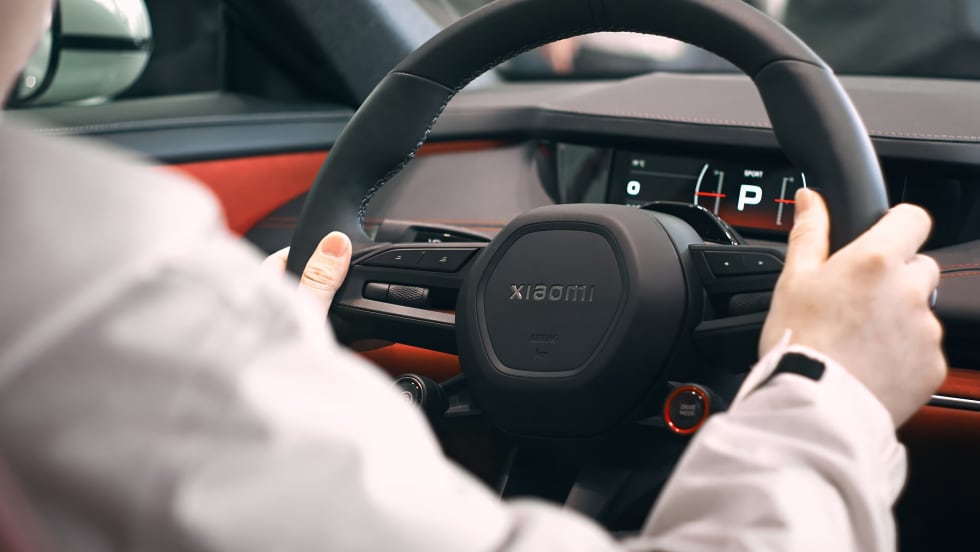
Exposure Drives Interest in Chinese Cars
At a recent demonstration, consumers had the chance to ride in a Chinese-branded vehicle, a firsthand experience that improved their perceptions and purchase intent.
Read More →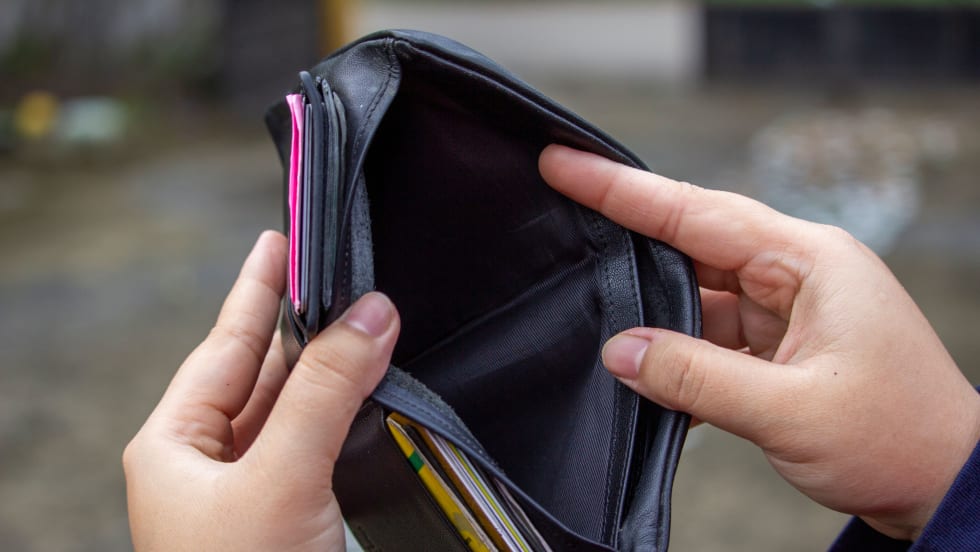
Automotive Consumers Sink Further in Debt
Most financing metrics hit records in the second quarter as more buyers locked themselves into long terms and high monthly payments.
Read More →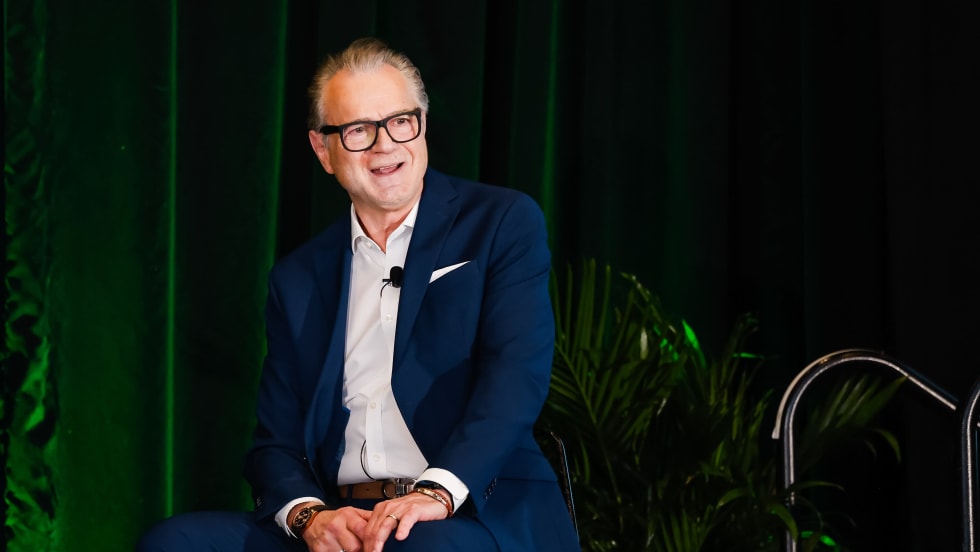
Agent Advocate
Rob Mancuso, who comes from a long line of auto dealers, values general agents’ place in the industry and makes a case for them taking an even bigger seat at the table.
Read More →
Driving Under Distraction
Though consumers gave higher marks to new vehicles in JD Power’s most recent initial-quality poll, high-tech interference worsened, pointing to craving for simplicity.
Read More →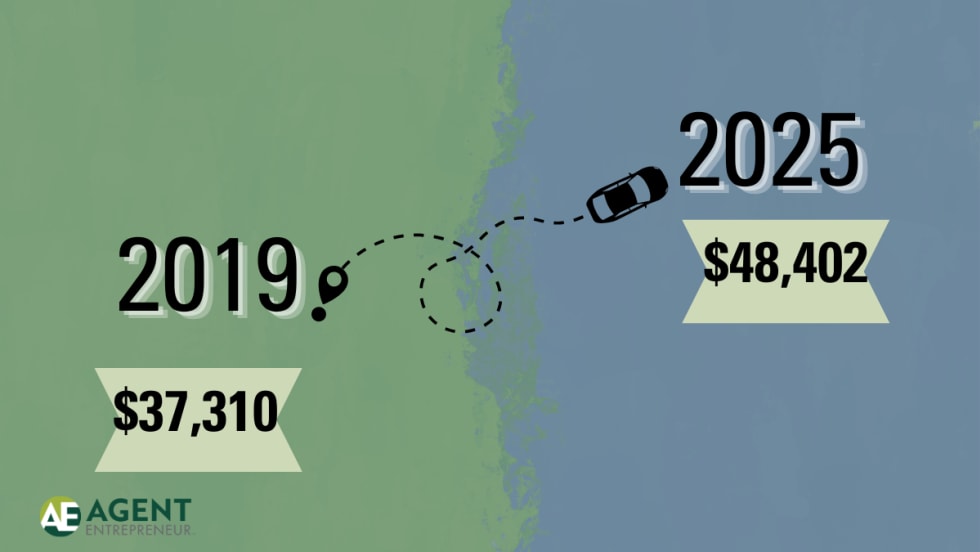
Affordable New Cars a Thing of the Past
More than one out of five new vehicles sell for more than $60,000, according to Edmunds. That's up 7% compared to prepandemic 2019.
Read More →